Yahzir Hood

Computer Science Portfolio
Showcasing my skills and projects in computer science and cybersecurity for college applications.
Projects
Showcasing my skills in computer science and cybersecurity projects.
Data Analysis
Using Python, I created a multiple-regression model to analyze the mental health aspects of Canadian college students from a survey by Jennifer Reeves and Theone Paterson. The dataset contained over 147 columns, requiring careful organization and analysis to ensure accurate results. This experience enhanced my data management and analytical skills, while highlighting the importance of deriving meaningful insights from complex data.
Data Analysis Project Steps
Composing a DataFrame
Project Overview
For this project, I used my Python skills to get, clean, prepare, and analyze data for predictive analysis. My goal was to accurately predict the happiness levels reported by each student in the survey based on various aspects of their lives.
Getting the data
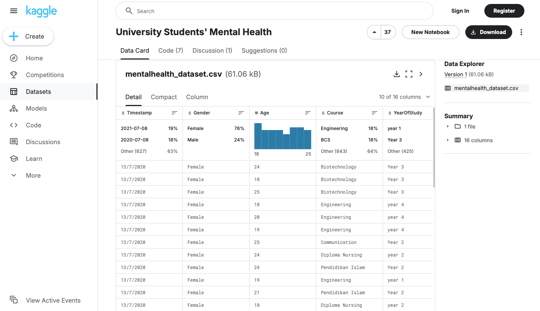
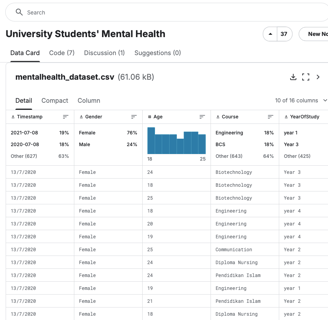
Before working with data, I first needed to find a suitable dataset. After exploring various sources such as Google’s “Dataset Search” and Tableau, I ultimately chose Kaggle because it best met my specific needs. At the time of this project, I was taking a college psychology class, which inspired me to focus on a topic related to mental health. This led me to a study conducted by Theone Paterson and Jennifer Reeves.
All credit of the original survey goes to Theone Paterson and Jennifer Reeves
Cleaning the data
To begin, I loaded the necessary CSV file to examine the data I would be working with. Using a few lines of code, I created a new DataFrame and discovered that it contained over 1,600 rows and nearly 150 columns of data. However, I noticed that almost a third of the dataset was incomplete. After reviewing the original survey files, I determined that the missing data came from applicants who had not submitted a complete survey. Once I removed the empty rows, I focused on identifying the columns that would best align with my project goals.
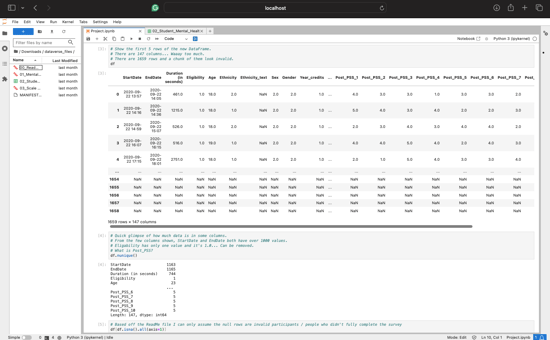
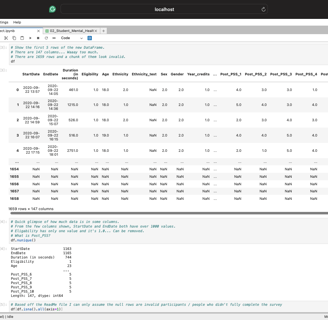
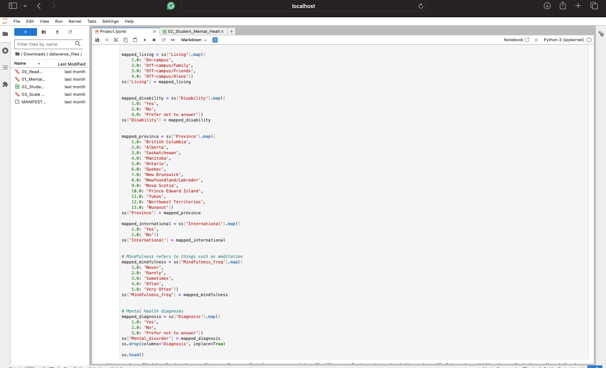
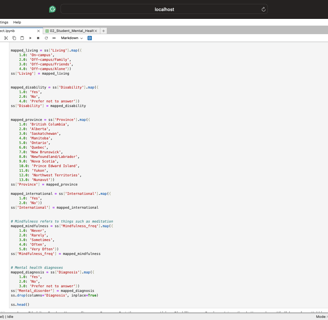
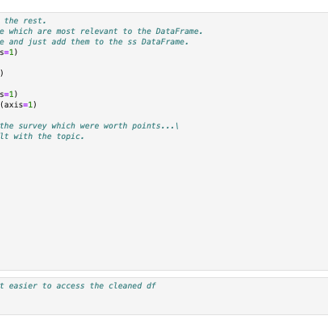
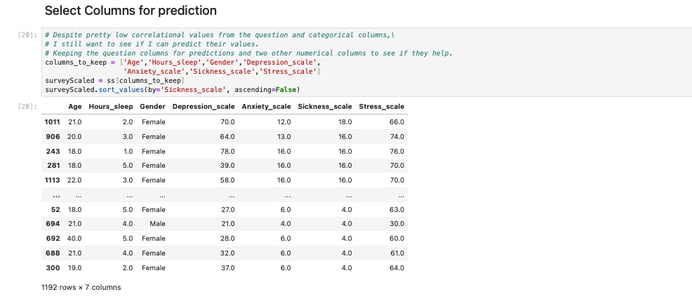
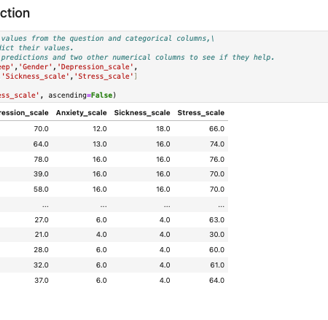
After removing the empty rows, I noticed additional issues with the dataset. Many columns had vague names, such as Post_PSS_1. To address this, I reviewed each column and its purpose in the survey to identify the ones most relevant to my project. I selected columns that I believed could best represent levels of happiness, such as the amount of sleep students reported. Once I finalized my list, I renamed the vague column names for clarity and sorted the DataFrame using six of the chosen columns to better visualize the scaling systems implemented by the authors of the survey. Finally, I saved the cleaned DataFrame as a pickle file for future use.
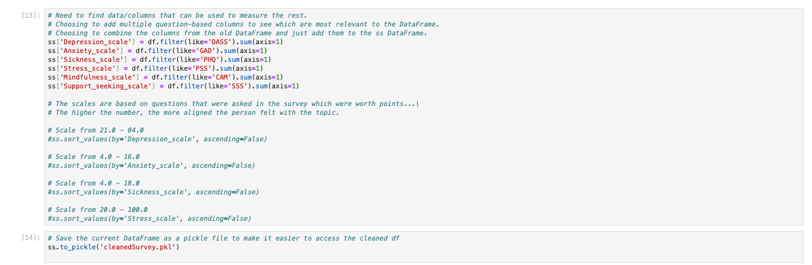
Starting the Predictions
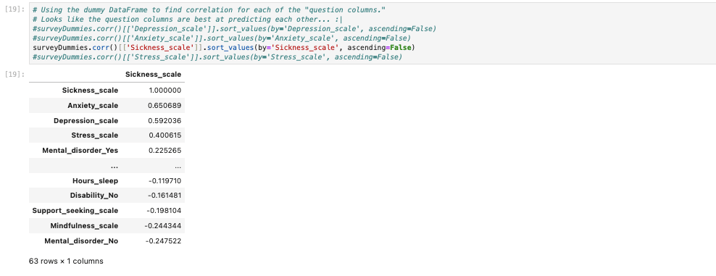
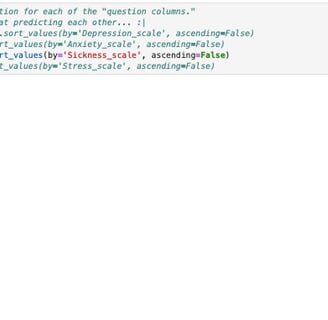
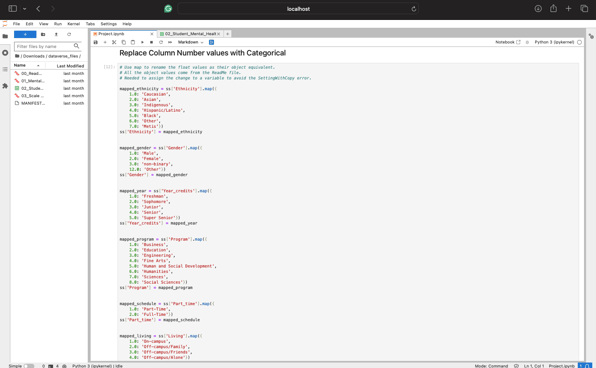
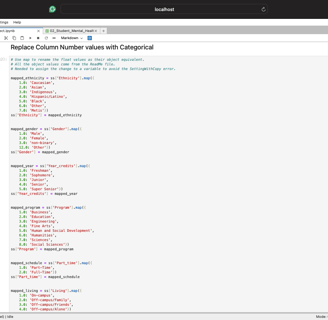
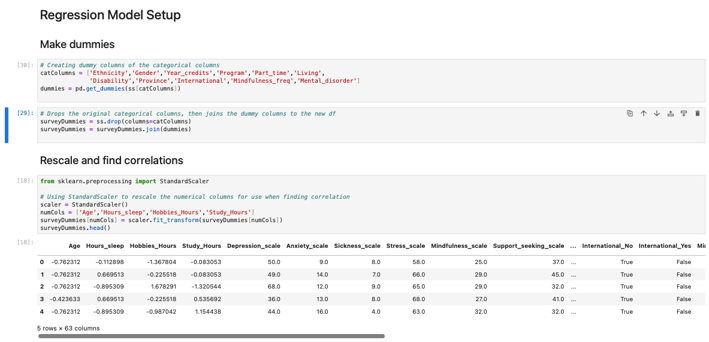
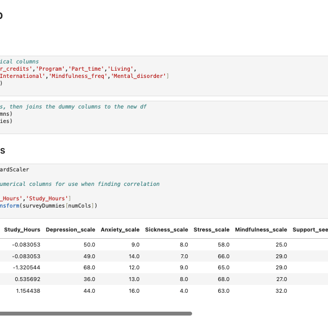
Since most of my selected columns were categorical or non-numerical, I decided to convert them into dummy variables to make them usable for analysis. Around this time, I also tested and removed two columns (Mindfulness_scale and Support_seeking_scale). I determined that these columns either would not contribute meaningfully to the predictions or were too vague to be used within a reasonable scope. After finalizing my selection, I sorted the remaining four columns individually to analyze their correlations with the other columns in the dataset.
Creating Dummy Columns
Creating and using the model
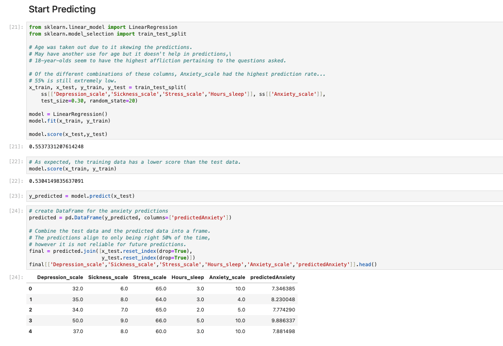
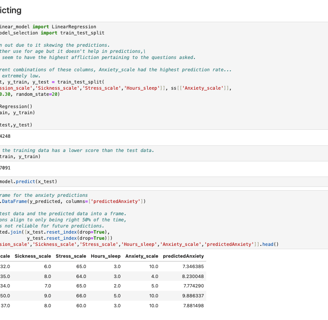
I began this section by selecting a column to serve as the X variable, with the remaining columns as the Y variables. I chose the Anxiety_scale as the X variable. Once the columns were defined, I created a multiple regression model to fit and score the data. Although, the initial score was not as high as I had hoped, I decided to continue training the model to experiment with its performance. I then generated predictions, created a new column from these predictions, and combined it with the original columns in a new DataFrame.
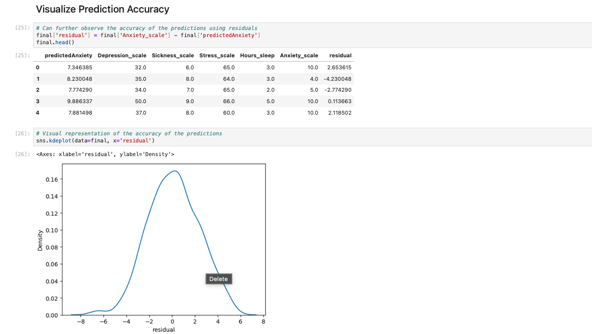
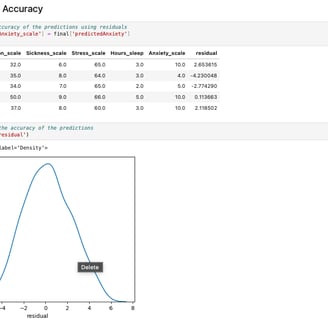
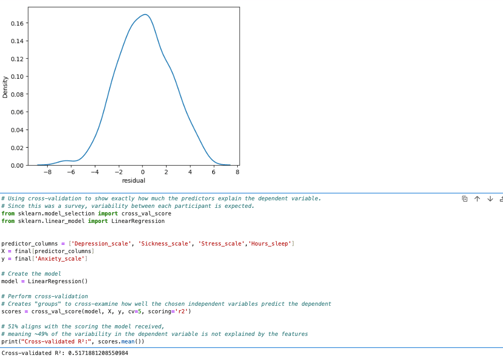
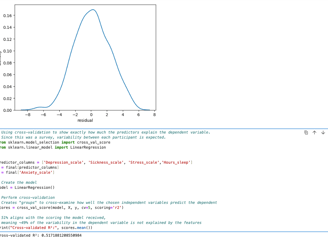
Visualizing Accuracy
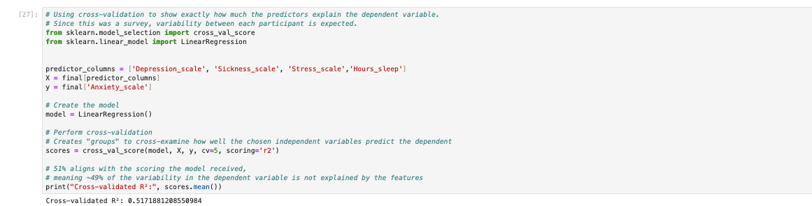
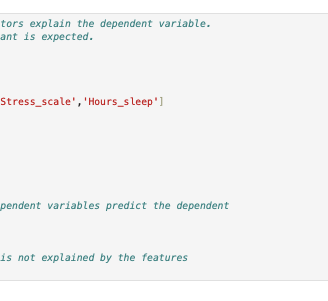
Even though the model indicated an accuracy of around 55%, more reliable methods exist for evaluating the performance of a predictive model. I used two approaches to validate the predictions of the multiple regression model. The first method involved analyzing the residuals, the differences between the actual X variable values and the predicted values. I visualized these residuals using a KDE plot, which confirmed an accuracy of approximately 50%. The second method was cross-evaluating each independent variable against the X variable to assess precision from a different perspective. This analysis returned an R² value of approximately 52%, indicating that only about 52% of the variability in the data could be accurately explained by the model.
Conclusion
The primary goal of my project was to practice my programming skills in data analysis and accurately predict the happiness levels reported by each student in the survey based on various aspects of their lives. I achieved this by cleaning and visualizing data from a survey. My initial objective of predicting college students' happiness based on their daily activities and mental attributes was unsuccessful; however, I gained valuable experience experimenting with analyzing a random dataset and making predictions. If I were to approach this project differently, I would definitely use the "SelectKBest" method to identify the optimal groupings of independent variables, which might have improved the accuracy of my analysis.
Preparing the data
Portfolio
Showcasing my skills in computer science and cybersecurity.
Connect